Wednesday, December 8, 2010

Lab 8 - Mapping Census 2000 with ArcGIS

Final Assignment:

In this final lab I created 3 thematic maps of 'Black', 'Asian', and 'Some Other Race Alone' populations in the continental U.S. using data from the U.S. 2000 Census as posted below.
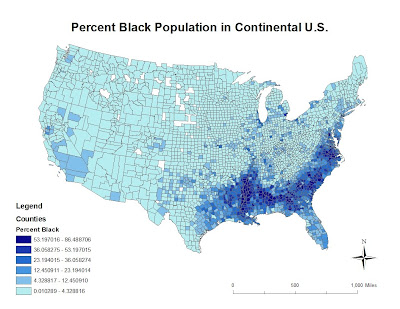

This map depicts the percent Black population in the United States in 2000 based on Census data. Counties within the continental U.S. are outlined so that the population can be seen and analyzed in detail. We find a large Black population percentage in the southeast. There is also a noticeably large concentration in Southern California. The highest percentage ranges from 53 to 96 % of the entire U.S. population, while a few counties in the Midwest have no Black populations.


This map displays the percent Asian population in the continental United States according to 2000 Census data. Most counties have a small percentage of Asians, creating a relatively even distribution across the country. The highest concentrations are found along the West Coast, especially in California, and along the East Coast in New England. The map also reveals a large population in a Texan county. Again, there are a few scattered counties with no Asians in states like Nevada, Texas, and some Midwest states.

This last maps shows the percent population of some other race alone across the continental Unites States. 'Some other' includes races besides Black, Asian, or non-Hispanic white. The western half of the U.S. has more racial diversity as represented by the darker green shades. The lighter green color that makes out the rest of the country reflects the small percentage of "Some Other Races Alone' in the eastern United States. Once again, California, Washington, and Texas stand out with the highest percentages.

This thematic Census map series reveals much about the United States population as well as the map-making process, from data acquisition to creating a personalized final product. While U.S. Census data is readily available online, one needs the know-how to convert it into a usable file and to join data layers to produce a map. The use of color ramps and classifications helps visually demonstrate the differences between regions, counties, and other scales within the country. In my three maps, darker colors represented higher percentages of the specific race. I found that the highest percentages of blacks are found in the southeast, highest percentages of Asian along the West and East coast, and the greatest percentages of other races along the Western United States.

Geography 7 has officially come to an end, but the possibilities from here are truly endless. It has been a learning experience every step of the way, and I am proud to have produced a variety of maps to show for it. There is undoubtedly much more to learn in the ArcGIS program, which can only come by spending more time with the program and familiarizing myself with the various tools and processes. I have only dealt with the tip of the GIS iceberg, yet I have undoubtedly developed a new-found skill and appreciation of maps and their potential to communicate.

Friday, November 26, 2010

Lab 7 - Mapping the Station Fire in ArcGIS

Lab 6 - DEMS in ArcGIS

After acquiring DEM data from the USGS website, I created a set of maps of the Grand Canyon in Arizona. I chose this famous historic site because of its dramatic and intricate elevation changes. Carved by the Colorado River, the Grand Canyon extends 277 miles and boasts areas as wide as 18 miles and deeper than a mile. Most of the area lies within the Grand Canyon National Park, which helps preserve its rich geological history and diversity of species. As an extensive rift in the Colorado Plateau that contains Proterozoic and Paleozoic layers, any section of the Grand Canyon is sure to produce a unique Digital Elevation Model. The slope of the area I selected remains fixed for the most part, thus producing a virtually single-colored map. However, the other 3 maps proved visually stunning, reflecting the impressive landscape of the Grand Canyon and the flowing Colorado River.

Extent information:
N: 36.47169*
W: -112.15541*
S: 35.98538*
E: -111.74667*

Geographic Spatial Coordinate System:
GCS North American 1983


Grand Canyon, Arizona
3D Elevation Model

Friday, November 12, 2010

Lab 5 - Projections in ArcGIS

Map projections allow us to view the world on flat, portable surfaces like a piece of paper, and on the computer screen using digital map data. Since the Earth is more or less a 3-D sphere, projections are key in translating the world into a more practical 2-D format. The Earth can be represented at various scales depending on the type of projection. Consequently, the three-dimensional Earth can be observed and analyzed from different perspectives and in appropriate detail.

Perils of map projections predominantly lie in their inevitable distortions. Map projections using different developable surfaces, such as planes, cones, and cylinders, produce various distortions. As we transfer information from the real world to a virtual map, projections distort the shape, area, distance, and/or direction of the Earth. For example, the maps below show significant variance in distance between Washington, D.C. and Kabul, Afghanistan based on the projections used. Thus, mapmakers and readers must be wary of the map’s scale and purpose when choosing an appropriate projection.

Map projections offer a much more transportable, useful means of transferring geographic information compared to physical globes, and moreover, allow the user to cater to specific mapping tasks. One can choose from hundreds of projections to best serve the scale and function of the map, whether it is for a small-scale map of the entire world or a detailed area of a city. If one is looking to calculate the true distance between Washington, D.C. and Kabul, for instance, one should use an equidistant map. There is a map projection to serve almost any criteria. Ultimately, the user has the power to decide and can even use multiple ones to map the same area as I did below.

In this week’s lab we explored three classifications of map projections - equidistant, conformal, and equal area – based on distortion properties. The equidistant projections – Equidistant Conic and Sinusoidal – both maintain distances from the center or along specified lines. I mapped two conformal projections – Mercator and Stereographic – that preserve angular relationships and the shapes of local areas. Lastly, the two equal area projections – Mollweide and Bonne – maintain the same proportional areas as the real world and exhibit true directions from the map’s center. Exploring these various map projections and their characteristic distortions heightened my geographic understanding and helped me appreciate the importance of educated mapmaking and reading.


Wednesday, November 3, 2010

Lab 4 - ArcMAP

Navigating ArcMap was an overall positive experience, albeit requiring much patience and further practice. Since my first time going through the tutorial primarily consisted of just following step-by-step directions, it was not until the second and third time that I started to really think about and grasp the purpose and usefulness of the program. I learned that it is essential to have the goal of the map in mind from the beginning and throughout the mapmaking process. What do I want to map? What elements need to be included for readers to understand my map? Such are questions that I need to answer at the outset; they will help define how I navigate the ArcMap program.

The goal in this tutorial was to create a map for a county seeking to expand its airport. We considered noise affecting schools and houses near the airport, as well as increased traffic along major roads. With each exercise, I included new features, referenced, and worked with the data to create complementary, informative maps.

GIS possesses significant potential in geographic data exploration and map creation. It has real-world value, as it helps communicate and work out problems effectively with more visual impact. Spatial data is used to explain patterns and predict relationships between populations and other elements mapped. By enabling the user to selectively reference data, one can narrow down variables of interest for focused study. Furthermore, computer-based GIS allows for analysis of a large amount of data in a timely manner.

GIS is not without possible pitfalls. From my initial experience with ArcMap, I realized that extensive practice with the program is needed to fully utilize all the tools to create proper maps. The technical know-how involved limits GIS software to educated users. GIS may oversimplify the world as well, failing to take into account the full context of the variables. As user-centric representations of the world, GIS maps as with all maps may vary according to the creator’s intentions and capabilities. This can lead to ambiguity or misinterpretations.

I plan to continue exploring and using ArcMap consistently to become a truly equipped, knowledgeable mapmaker and critical reader. The following is the map that I produced through the ArcMap tutorial:

Tuesday, October 12, 2010

Lab 3 - Neogeography


View T-Shirt Lifecycle in a larger map

Neogeography allows people to create and personalize their own maps to better document and convey their views of the greater world. By utilizing existing tools and application programming interface (API) like Google maps, one can design and highlight location information. The potential of Neogeography lies chiefly in the purpose that it serves. The interactive nature of mashup or dynamic maps enables both the map creator and viewer to more personally understand the content that is being mapped. Connecting certain elements, as well as adding images and media, infuses more meaning into the map.

Pitfalls and consequences of Neogeography exist. The fact that anyone can create maps on Google or other sites diffuses authority. How do we distinguish an authoritative, expert map from a random mashup of useless information? Does the map even serve a purpose? Adding too many dynamic features and multimedia can be distracting and consequently detract from the ultimate goals of the map. Furthermore, there is the issue of privacy. With increased availability of information online today, Google maps could be used to invasively map out otherwise low-key locations, such as military camps or domestic violence shelters. Notwithstanding, I hope that my dynamic map serves a meaningful purpose. Take a look!

Tuesday, October 5, 2010

Lab 2 - USGS Topographic Maps

The 7.5 Minute Map

1. Beverly Hills
2. Canoga Park, Van Nuys, Burbank, Topanga, Hollywood, Venice, Inglewood
3. 1966
4. Horizontal datums: North American Datum of 1927 (NAD 27) and
North America Datum of 1983 (NAD 83)
Vertical datum: National Geodetic Vertical Datum of 1929
5. 1:24000
6. a) 1/24000 = 5 cm/x
x = 5 cm * 24000 = 120,000 cm = 1,200 m
b) 1/24000 = 5 in/x
x = 5 in * 24000 = 120,000 in
120,000 in * (1 mi/63360 in) = 1.894 mi
c) 1/24000 = x/1 mi
x = 1/24,000 mi
1/24,000 mi * (63360 in/1 mi) = 2.64 in
d) 1/24000 = x/3 km
x = 1.25 * 10^-4 km
(1.25 * 10^-4 km) * (100,000 cm/1 km) = 12.5 cm
7. 20 feet
8. a) 34°4'30" (34.075°) N and 118°26'15" (118.438°) W
b)
34°00'30" (34.008°) N and 118°30'00" (118.5°) W
c) 34
°07'00" (34.117°) N and 118°24' 30" (118.408°) W
9. a) 580 ft = 176.784 m
b) 140 ft = 42.672 m
c) 700 ft = 213.36 m
10. UTM Zone 11
11. 361,500 m Easting and 3,763,000 m Northing
12. 1,000,000 m^2
13.


14. +14°
15. South
16.